Know Rust? Learn CUDA by Solving GPU Challenges
Write Rust GPU kernels with cuda-oxide in GPUFlight Performance Lab, inspect PTX, and compare profiling results with CUDA C++.
Are you a Rust developer who wants to learn CUDA programming?
Try a GPU programming challenge in Rust. Write a kernel, run it on a real GPU, and use profiling to see what your code is doing.
I added Rust support to GPUFlight Performance Lab so you can do exactly that. Start with a provided problem, make a change, and compare the results.
Learn GPU programming in Rust by solving hands-on challenges in GPU occupancy, memory coalescing, shared-memory bank conflicts, tiled matrix multiplication, atomic contention, warp-level reductions, stencil optimization, online softmax, and so on.
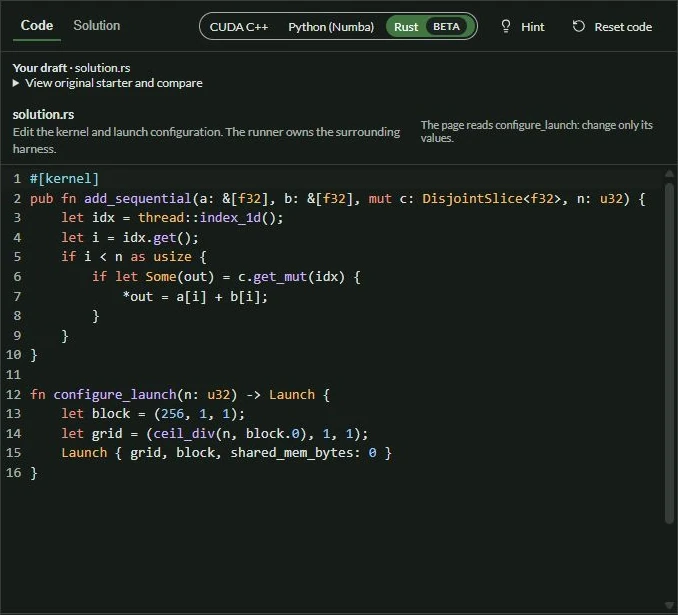
Open Vector Add in Rust to try the example yourself.
Comparing Rust with CUDA C++ has been a useful way to see how each compiler handles the same work.
One thing I keep coming back to is the compiler output. The source code tells me what I asked for. Looking at the compiled instructions helps me understand what happened to it.
With NVIDIA introducing CUDA Rust, there is more to explore here. GPUFlight’s Rust labs use cuda-oxide, which compiles Rust kernels to PTX.
PTX is an intermediate instruction language for NVIDIA GPUs. It sits between your source code and the machine instructions the GPU executes. You can follow the loads, arithmetic, checks, and branches.
That makes it useful for learning.
Try vector addition in Rust
I started with vector addition. Each GPU thread reads two values, adds them, and writes the result. Here’s the code I used for the Rust run. You can paste both functions into the lab’s Rust editor.
#[kernel]
pub fn add_sequential(a: &[f32], b: &[f32], mut c: DisjointSlice<f32>, n: u32) {
    let idx = thread::index_1d();
    let i = idx.get();
    if i < n as usize {
        if let Some(out) = c.get_mut(idx) {
            *out = a[i] + b[i];
        }
    }
}

fn configure_launch(n: u32) -> Launch {
    let block = (256, 1, 1);
    let grid = (ceil_div(n, block.0), 1, 1);
    Launch { grid, block, shared_mem_bytes: 0 }
}
The kernel handles one pair of numbers per thread. The lab starts with one thread per block. In this run I used 256. The grid rounds up so there’s a thread for every element. The index check keeps extra threads in the last block from writing past the end.
What changes in the compiled code?
The CUDA C++ version uses raw pointers. It checks whether the thread’s index is below the element count, then performs the addition.
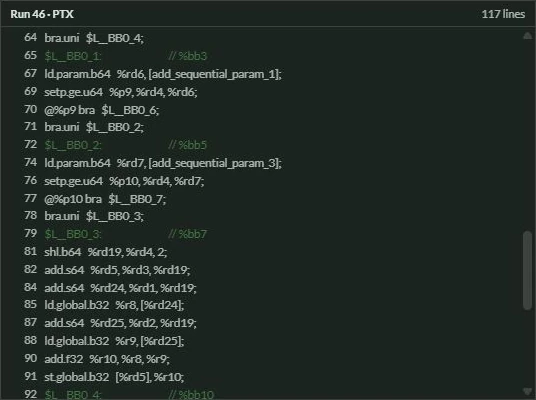
The Rust version uses slices for the inputs. A slice carries its length along with its address. In this example, the compiled code checks whether each input access stays within that length.
Both versions do the same basic work. But the interfaces give the compiler different information.
When I first saw the longer Rust listing, I wondered how much extra work it was doing.
Reading the PTX helped. I could find the same two loads, addition, and store in both versions. In Rust, I could also follow the input checks to the paths that trap on an invalid access.
The measured kernel times were close: about 0.85 milliseconds for C++ and 0.86 milliseconds for Rust on the L4.
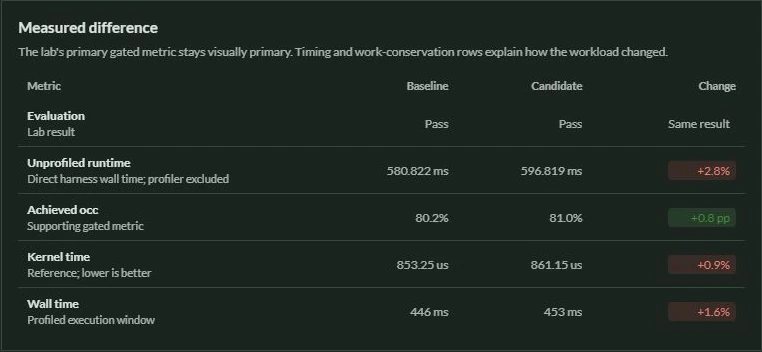
That small difference needs repeated measurements before drawing conclusions. These implementations also use different toolchains and PTX versions. The listing length alone cannot tell us which will run faster.
What interested me was seeing some of the design choices become visible.
In this C++ interface, the programmer is responsible for providing valid buffers. The Rust slice interface carries information used to check accesses. Those checks can also be removed when validity can be established. The cuda-oxide documentation explores this in more detail.
This is the kind of exploration I want Performance Lab to make easier.
You start with a problem, some code, and a measurable target. Choose Rust in a supported lab, edit the kernel, and run it on a managed GPU.
Then inspect the result. Change one thing and run it again. Select two completed runs and click Compare to examine their saved source, profiling results, and compiled code.
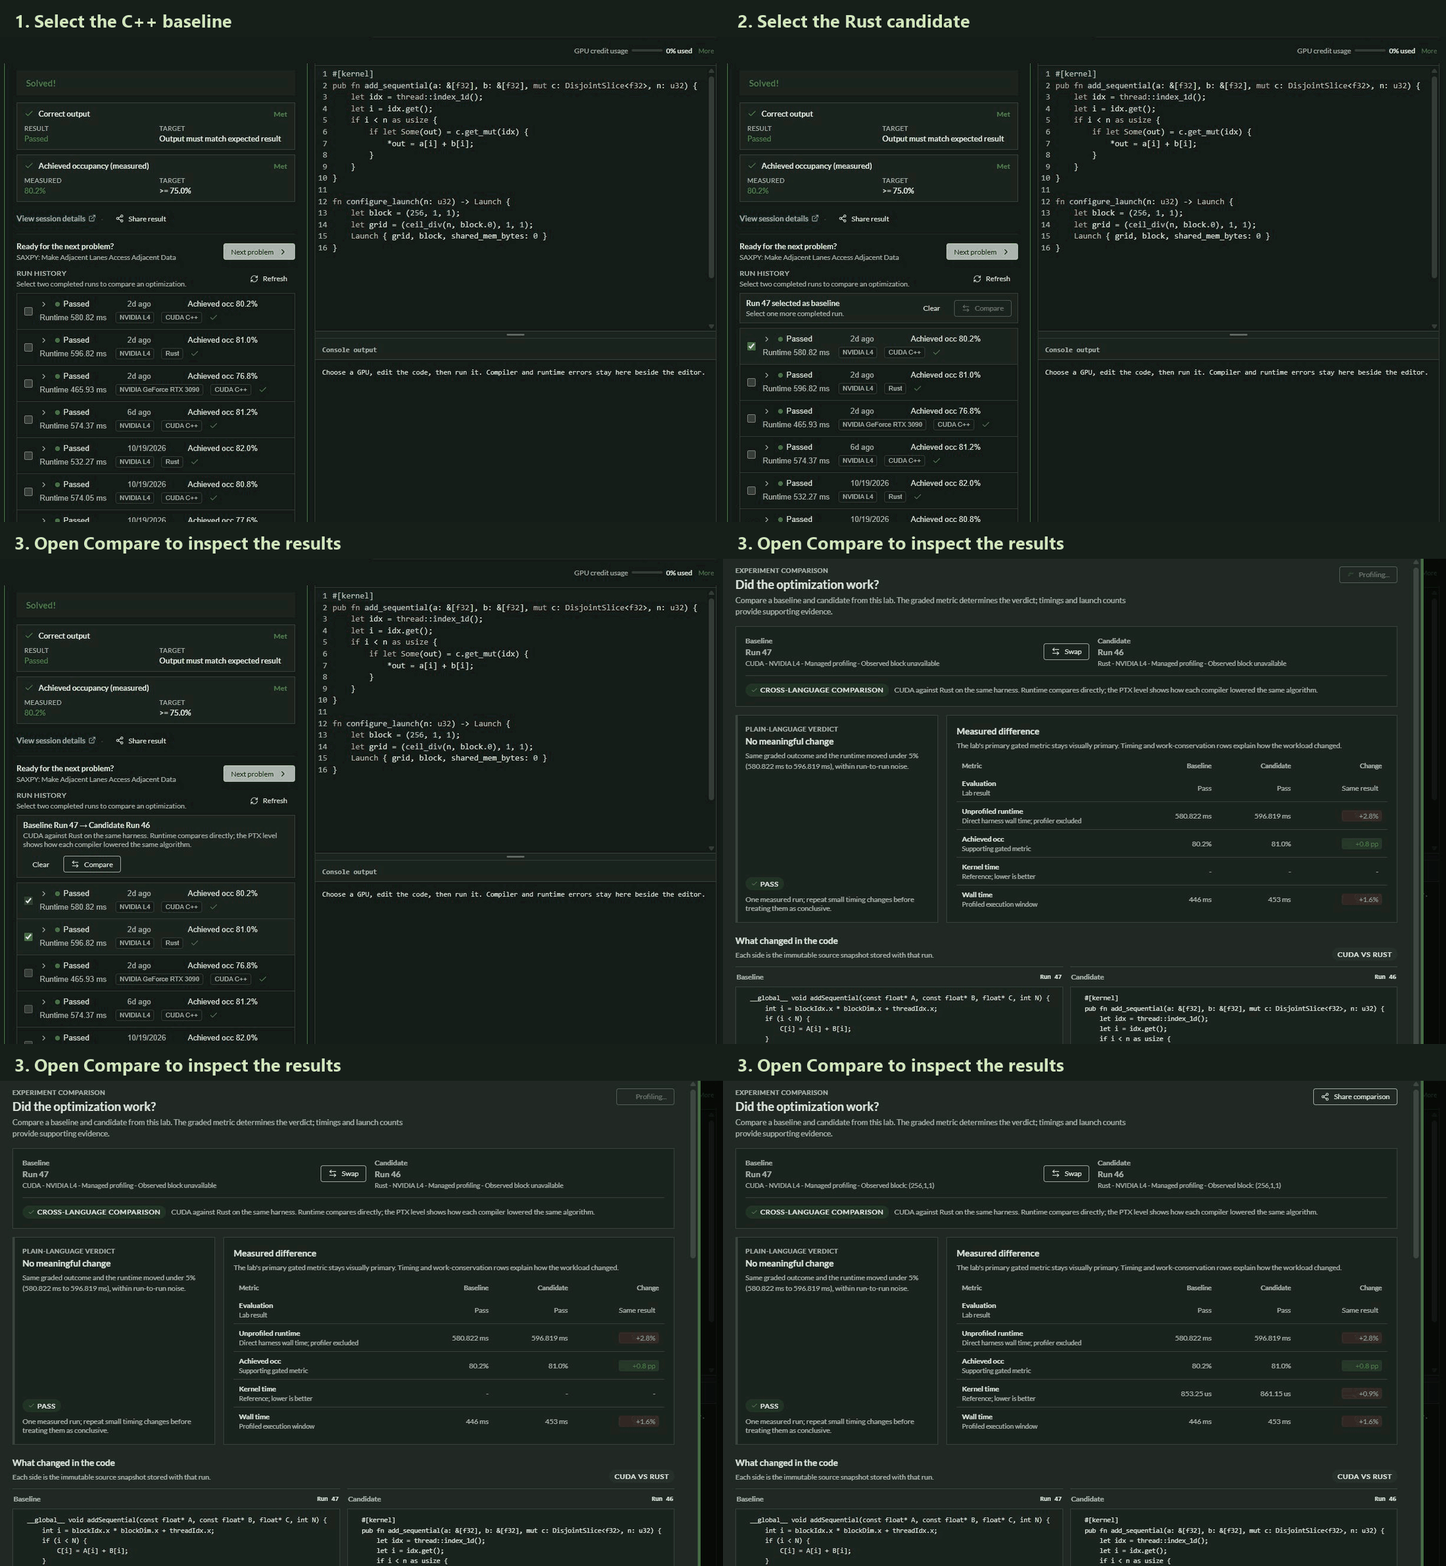
You can compare two Rust implementations or look at Rust alongside CUDA C++.
Rust support is still in beta, and language availability depends on the lab.
I developed the lab solutions with AI assistance. If you spot anything incorrect or see a more efficient approach, please let me know!
If you’re curious about Rust on the GPU, start with a small kernel. Follow what the compiler did with it. Then check the measurements.
Try the Vector Add lab in Rust and compare your runs.
Originally published on Medium.